
Go-Zero微服务框架怎么监控?Prometheus对接步骤
go-zero 微服务框架通过内置的 prometheus 模块和中间件实现监控,对接步骤主要涉及在启动时配置 prometheus 服务器地址并启用 http 指标收集。具体做法是在 goctl 生成的代码中修改 server.go,调用 prometheus.registermetrics() 注册全局指标,并在路由组中挂载 prometheus.middleware 以拦截请求数据。这样配置后,服务会在指定的 /metrics 路径暴露符合 prometheus 抓取格式的指标数据,无需手动编写采集逻辑。

如何配置 Go-Zero 服务以暴露 Prometheus 指标?
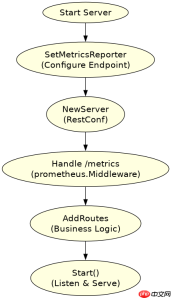
要配置 Go-Zero 服务暴露指标,需要在服务的初始化阶段引入 github.com/zeromicro/go-zero/core/prometheus 包,并调用其提供的注册函数。通常的做法是在 main.go 或 server.go 的启动逻辑中,先设置 Prometheus 的接收端点(Endpoint),然后创建包含 Prometheus 中间件的 Handler。这一步确保了所有进入该服务的 HTTP 请求都会被自动记录延迟、状态码和请求量等关键指标。
package main

import (
	"flag"
	"net/http"
	"github.com/zeromicro/go-zero/core/logx"
	"github.com/zeromicro/go-zero/core/prometheus"
	"github.com/zeromicro/go-zero/rest"
)

var (
	port = flag.Int("port", 8888, "service port")
	endpoint = flag.String("prometheus.endpoint", "http://localhost:9090/api/v1/write", "prometheus endpoint")
)

func main() {
	flag.Parse()

	// 1. 配置 Prometheus 指标上报目标
	prometheus.SetMetricsReporter(prometheus.NewPrometheusReporter(*endpoint))

	// 2. 创建 REST Server
	s := rest.MustNewServer(rest.RestConf{
		Port: *port,
	})
	defer s.Stop()

	// 3. 挂载 Prometheus 中间件,暴露 /metrics 接口
	handler := prometheus.Middleware(http.DefaultServeMux)
	s.Handle("GET", "/metrics", handler)

	// 4. 注册业务路由
	s.AddRoutes(YourRoutes...)

	logx.Info("Starting server...")
	s.Start()
}
上述代码展示了最基础的对接方式。首先通过 SetMetricsReporter 指定了指标数据的去向,这通常是 Prometheus 的 Pushgateway 或直接写入端点。接着,在创建 rest.Server 实例后,显式地挂载了 prometheus.Middleware 到 /metrics 路径。当 Prometheus 服务端发起 GET 请求访问此路径时,将获取到当前服务的运行指标。注意,YourRoutes 需要替换为实际的业务路由定义,且必须确保 /metrics 路由在业务路由之前或独立处理,以避免被业务逻辑拦截。
Prometheus 服务端如何抓取 Go-Zero 指标数据?
Prometheus 服务端通过静态配置或动态服务发现来抓取 Go-Zero 服务暴露的 /metrics 数据。在 prometheus.yml 配置文件中,需要添加一个新的 scrape_config,指定目标服务的 IP 和端口,以及 metrics_path。由于 Go-Zero 默认在 /metrics 路径暴露数据,因此需确保路径匹配正确。此外,为了区分不同的服务实例,通常会在配置中使用 relabel_configs 来注入标签,如 instance 和 job。

# prometheus.yml 示例配置
global:
  scrape_interval: 15s

scrape_configs:
  - job_name: 'go-zero-service'
    static_configs:
      - targets: ['localhost:8888']
        labels:
          service: 'user-service'
    metrics_path: '/metrics'
    scrape_timeout: 10s
在 prometheus.yml 中,job_name 定义了任务名称,static_configs 列出了具体的目标地址。对于 Go-Zero 服务,关键在于 metrics_path 必须设置为 /metrics,因为这是 prometheus.Middleware 挂载的路径。如果服务部署在 Kubernetes 环境中,可以使用 kubernetes_sd_configs 替代静态配置,利用 K8s 的服务发现机制自动发现 Pod 并抓取其指标。抓取到的数据包括 http_request_duration_seconds(请求延迟)、http_requests_total(请求总数)等标准指标,这些指标可用于后续在 Grafana 中构建可视化面板。
Go-Zero 服务在遇到高并发时 Prometheus 指标表现如何?
在高并发场景下,Go-Zero 服务通过 Prometheus 暴露的指标会实时反映系统负载变化,特别是 http_request_duration_seconds_bucket 和 http_requests_in_flight 指标。当并发请求激增时,in_flight 指标会迅速上升,表明当前正在处理的请求数量增加;同时,延迟分桶指标会显示更多请求落在较高的时间区间内。开发者可以通过观察这些指标的变化趋势,判断服务是否接近瓶颈,并及时进行扩容或优化。
为了验证这一行为,可以模拟高并发请求并观察指标变化。以下是一个简单的测试脚本,使用 wrk 工具模拟并发:
# 使用 wrk 模拟 100 并发,持续 10 秒
wrk -t100 -c100 -d10s http://localhost:8888/api/user/list
执行上述命令后,访问 http://localhost:8888/metrics,可以看到 http_requests_in_flight 的值显著增加,且 http_request_duration_seconds_sum 和 count 也在快速累积。这表明 Prometheus 能够准确捕捉到高并发下的服务状态。需要注意的是,Go-Zero 内部使用了缓冲通道和协程池来处理并发,因此在高负载下,指标的增长应该是平滑且可预测的。如果指标出现异常波动,可能意味着存在死锁或资源竞争问题,需要进一步排查代码逻辑。